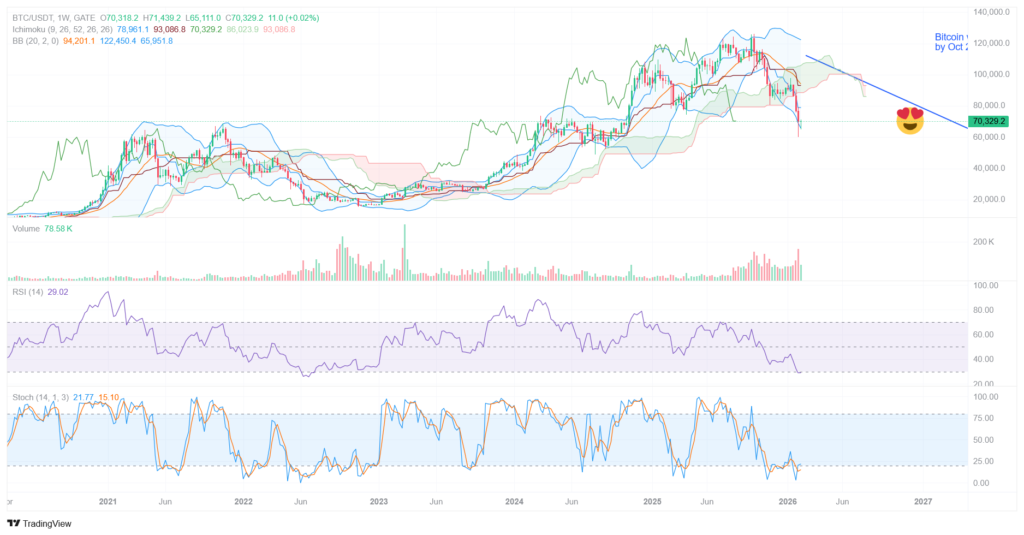
When in doubt, zoom out. Check for relevant pattterns: A head & shoulders confirmed and reaching its target value. Read the basic indicators: RSI, MACD, Stochastic, Ichimoku and Bollinger Bands. Capitulation volume? confirmed. All technicals seem oversold. Check the sentiment.The retail is gone. The institutions? are there any moral or regulatory shocks? Yes. Like towards the bottom of the previous bearmarket and the scandals surrounding the FTX exchange & Luna token price inflation scheme, the Jeffrey Epstein saga of late 2025 to early 2026 and scandals surrounding the Trump administration’s insider trading schemes are impacting the regulatory environment. Hence, Western institutions have put their crypto portfolios on hold. Scandals around popular stablecoins, such as Tether are bubbling under with accusations of connections to off the books proliferation of U.S. treasuries.
A picture is worth a thousand words, but I attempt to condense the logic behind my simple method of TA. I use this across all asset classes, always checking it before making a final decision whether to buy or to sell:
- RSI. Above / under 50, patterns, divergences.
- Pattern analysis: Adam & Eve and variations, Head & Shoulders and variations, Rounded bottoms & tops, McDonald’s and W, bullflags and bearflags, hockeystick followed with a tail towards top or bottom, rising and falling wedges & triangles, rising and falling megaphones, and yes sometimes I look at diamond patterns and Wyckoff’s too, but rather rarely, but in this order.
- MACD (not visible in the picture) used to confirm whether RSI analysis is correct.
- Stochastic to confirm the overall potential direction of the market.
- Ichimoku cloud, to get the big picture. The indicator is somewhat useful for price prediction during stable trends, but if the trend abruptly change, the indicator’s future prediction value also changes.
- Bollinger band, to confirm the remaining upward and downward potential in the immediate time horizon.
- Fibonacci extension and retracement values for indicating the likely next top and bottom zones. This indicator is fuzzy at best. I trade by approximating the likely goalposts throughout the cycle. This means that I’m a proactive trader: if the market stalls, I’ll sell. If a bottom is clearly forming despite my earlier analysis, I’ll buy.
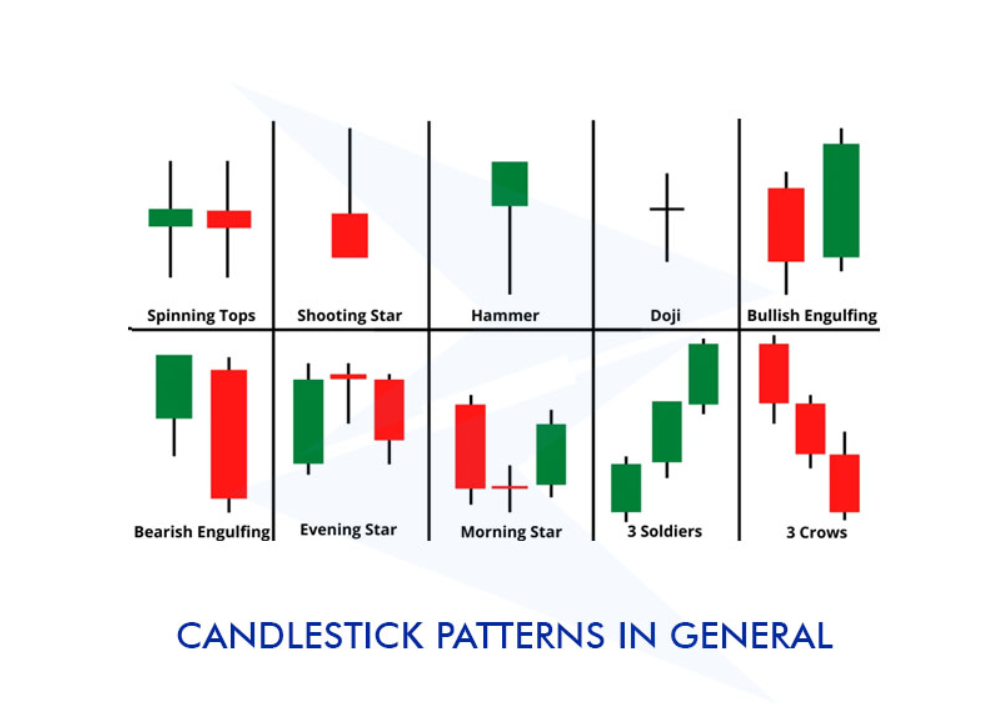
- Finally, candlestick patterns: Mainly I only use the basic candlestick patterns, in the picture below:
This being out of the way, I think that the indicators plus the volume, plus the institutional scandals usually indicating a bottom structure forming, plus the diminishing Google trends:
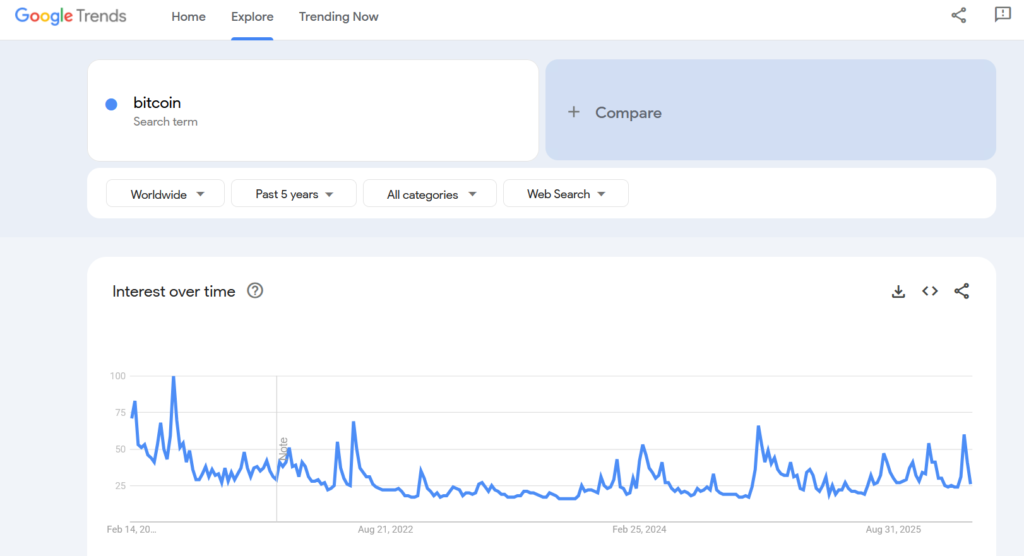
I think, and this is NOT FINANCIAL ADVICE, Bitcoin may be forming a bottom structure beginning Q1 2026. However, it’s safe to be prudent and consider that a bottom structure forming may not mean an absolute bottom in the asset price, but it can mean that a temporary surge is imminent and the broad bottoming structure should form within a reasonable timeframe. In Bitcoin’s case if the four-year cycle remains intact, the bottom should form about 6-9 months from miner capitulation, which reportedly has happened in early February 2026.
This would put Bitcoin’s exit from the current bearmarket between August and October 2026. The bottom therefore should form between February and May/June of 2026.
This is not financial advice and I am not a financial advisor. You do you. Do your own research. I’m buying. I’ll take a third job to cover evenings and weekends or whatever. Lock in brother. This may be our chance to exit the Matrix. To the Moon!